IO Performance
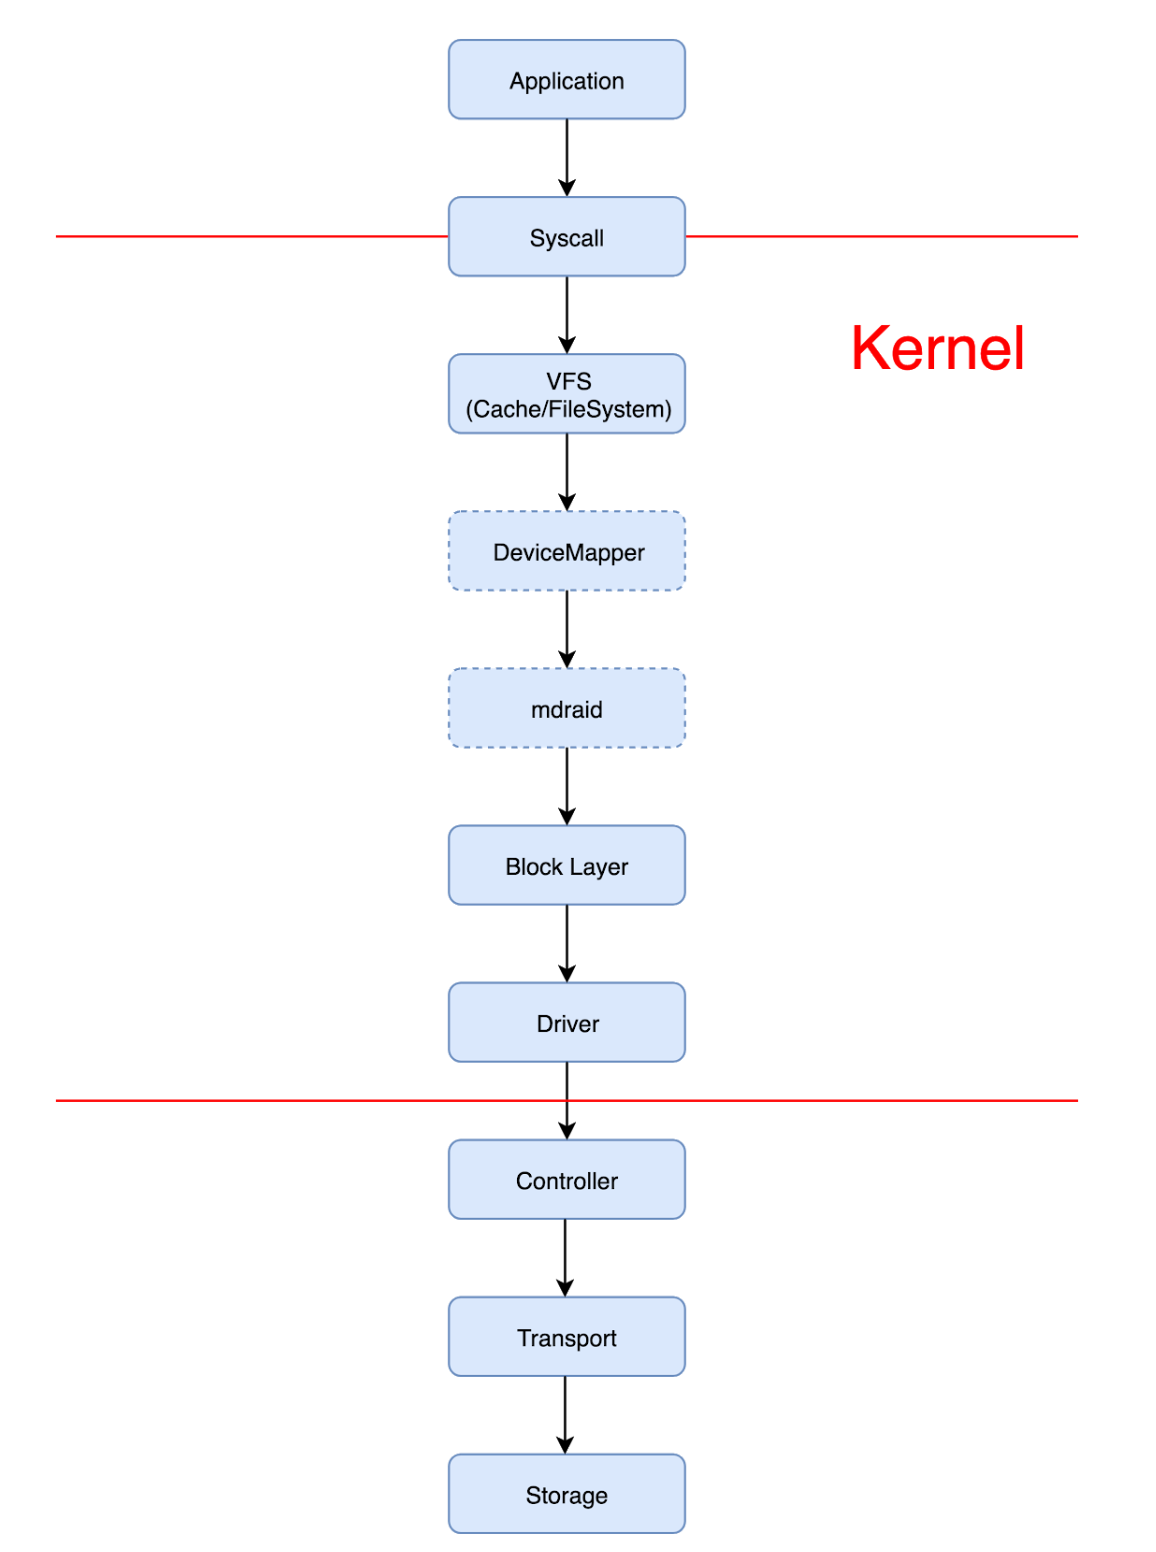
Linux IO Stack
Overview
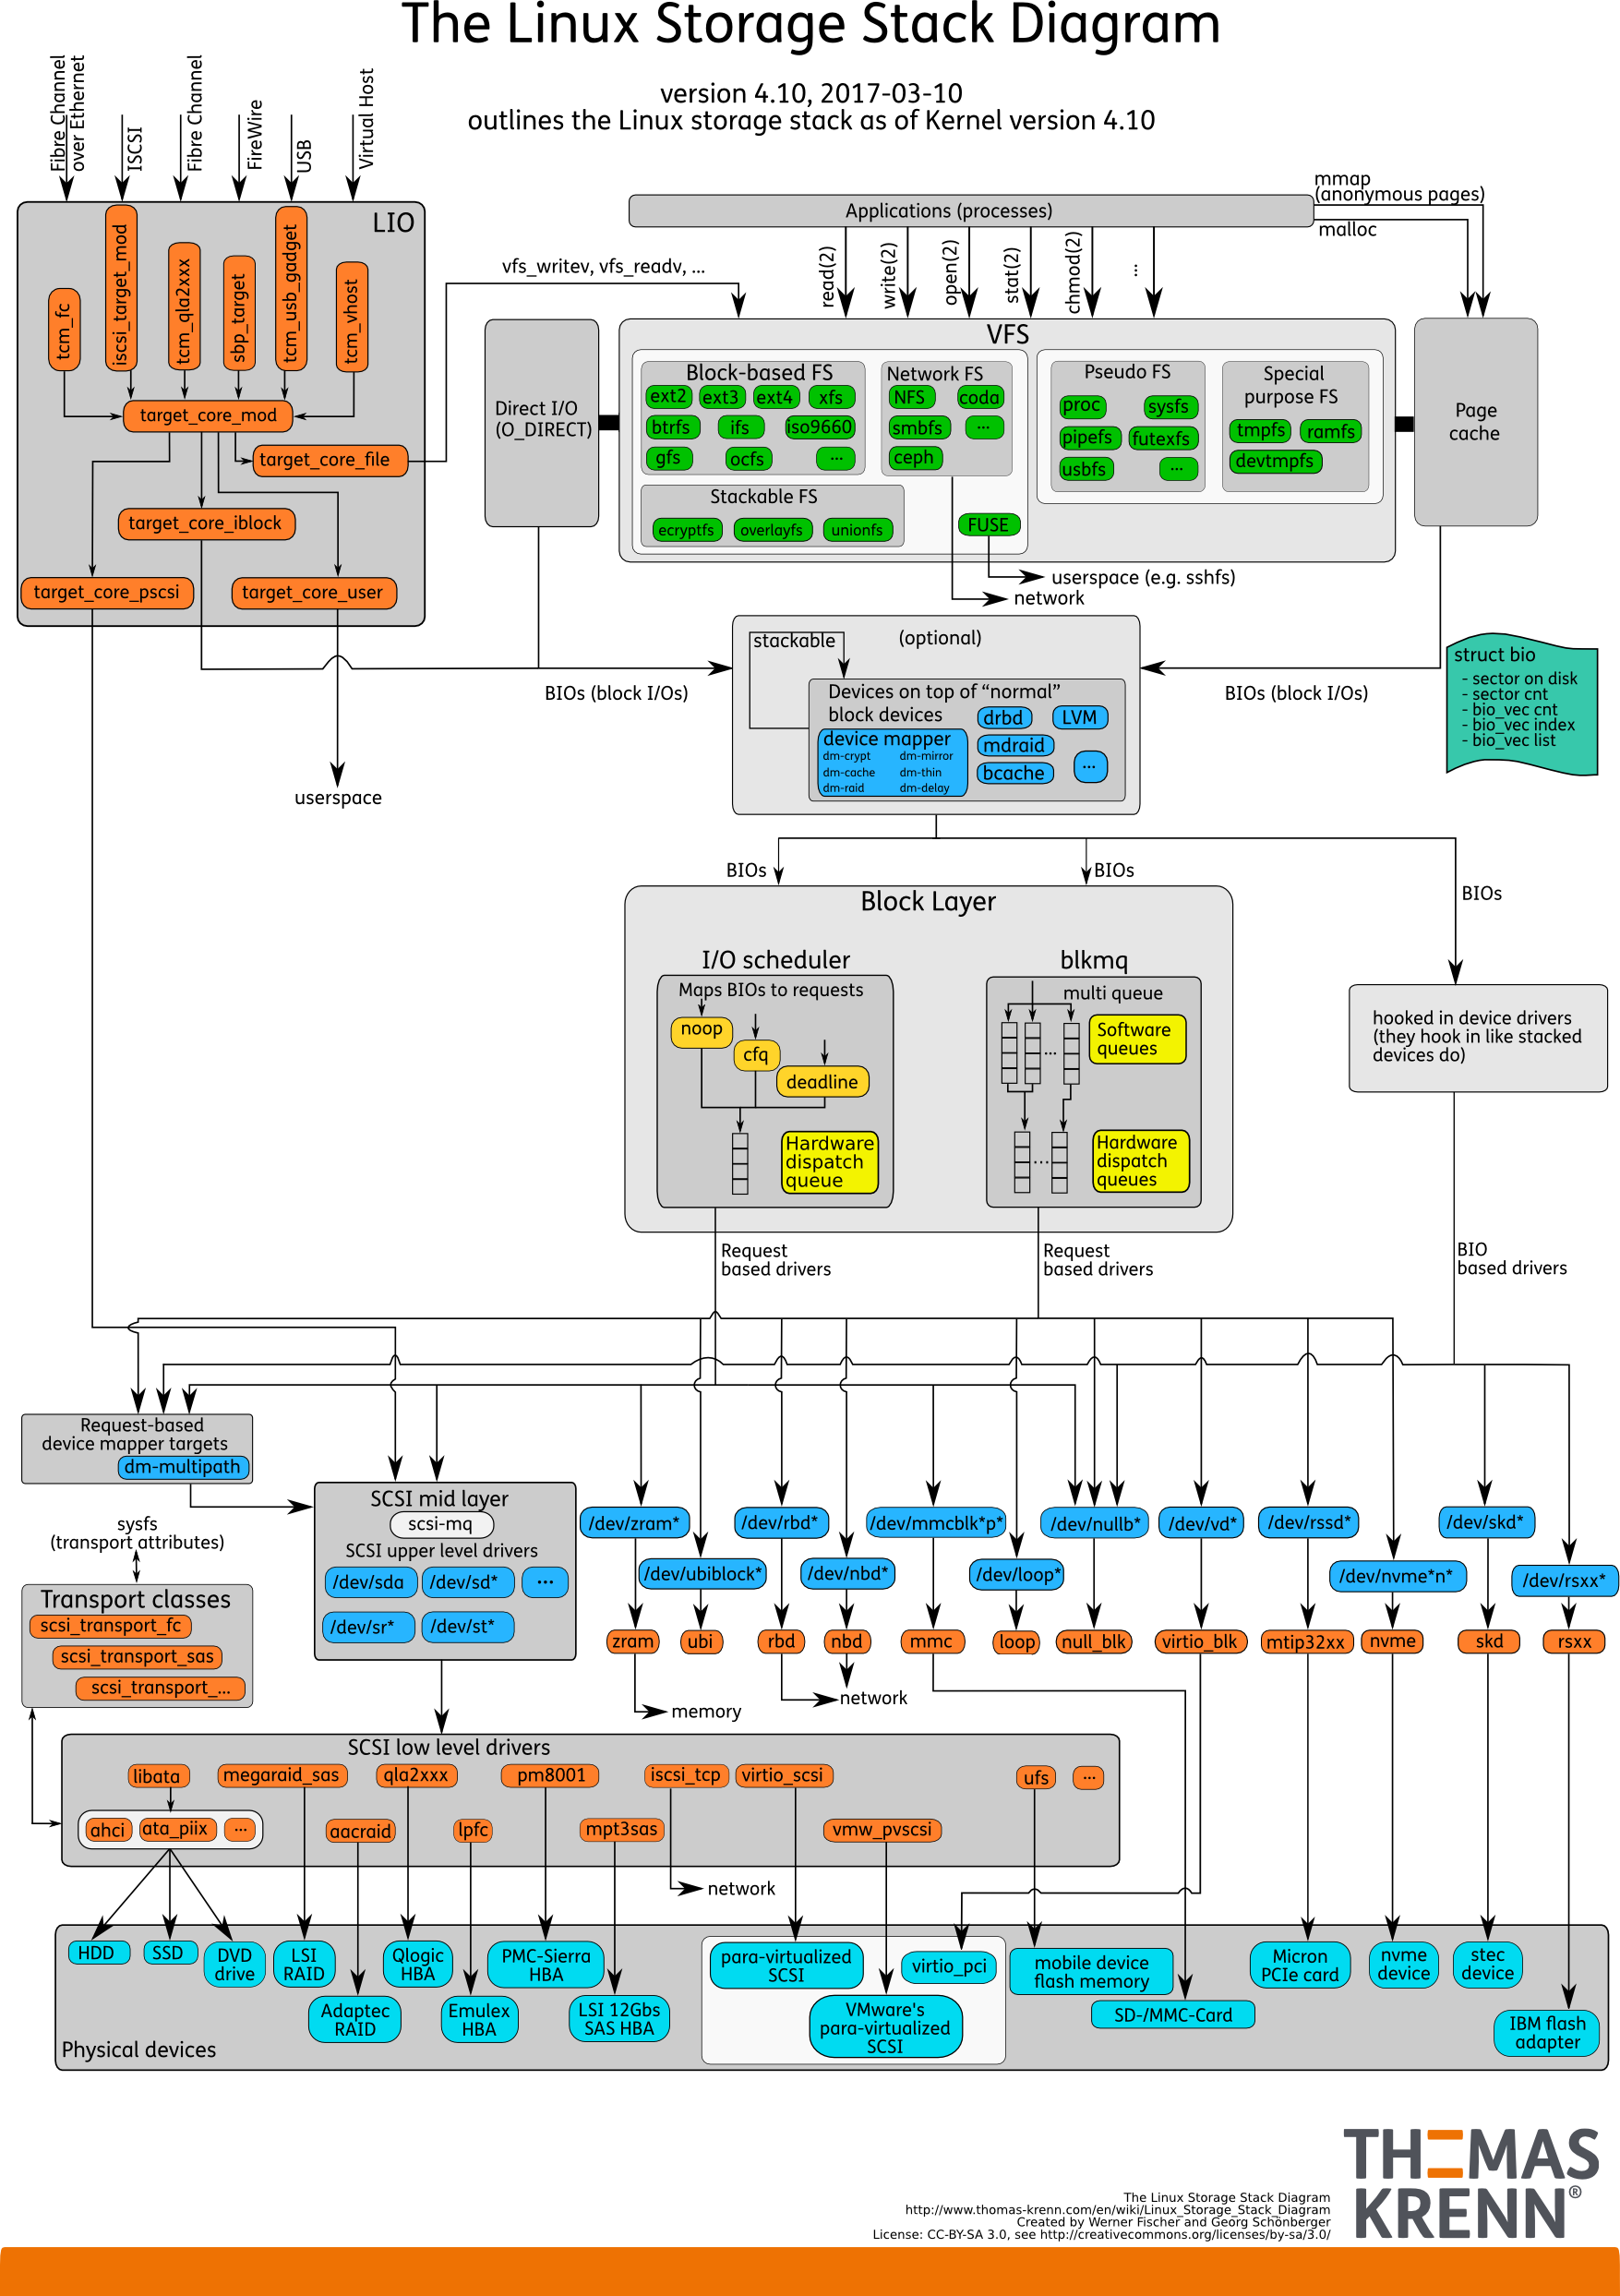
Nutshell
NOTE: The difference Between RHEL5 and Later Release: In RHEL 5 and previous, IO was merged by individual paths after device-mapper-multipath allocated it to underneath paths.
Time: 02:42:15 AM
avg-cpu:  %user   %nice %system %iowait  %steal   %idle
           0.75    0.00   24.47   12.36    0.00   62.42

Device:         rrqm/s    wrqm/s   r/s       w/s    rkB/s     wkB/s avgrq-sz avgqu-sz   await  svctm  %util
sda               0.00      0.00  0.00      0.00     0.00      0.00     0.00     0.00    0.00   0.00   0.00
sda1              0.00      0.00  0.00      0.00     0.00      0.00     0.00     0.00    0.00   0.00   0.00 sdb               0.00 134838.61  0.00   1081.19     0.00 552047.52  1021.19   105.60   99.01   0.92  99.21
sdb1              0.00 134839.60  0.00   1081.19     0.00 552047.52  1021.19   105.60   99.01   0.92  99.21
dm-2              0.00      0.00  0.00 135906.93     0.00 543627.72     8.00 13423.23   99.65   0.01  99.50
dm-3              0.00      0.00  0.00 135907.92     0.00 543631.68     8.00 13386.22   99.65   0.01  99.31
From RHEL6, “request-based device-mapper” was adopted by device-mapper-multipath. So io merge is happened in device-mapper-multipath before sending them to underneath paths.
12/25/2019 03:17:34 AM
avg-cpu:  %user   %nice %system %iowait  %steal   %idle
           0.56    0.00   25.17    4.34    0.00   69.93

Device:         rrqm/s    wrqm/s  r/s       w/s rkB/s     wkB/s avgrq-sz  avgqu-sz  await r_await w_await svctm  %util
sdb               0.00      0.00 0.00      0.00  0.00      0.00     0.00      0.00   0.00    0.00    0.00  0.00   0.00
sda               0.00      0.00 0.00    156.00  0.00 566732.00  7265.79     34.56 220.37    0.00  220.37  6.41 100.00
dm-0              0.00 113133.00 0.00    164.00  0.00 566732.00  6911.37    150.71 846.07    0.00  846.07  6.10 100.00
dm-1              0.00      0.00 0.00 113817.00  0.00 702732.00    12.35 111791.51 896.90    0.00  896.90  0.01 100.10
Linux IO information collecting tools
iostat
Usage
# iostat -xkt 1 <dev_name> [-p ]
-x display extended statistics
-k use KByte instead of sector as unit
-t show time
-p display partitions in RHEL6. In RHEL5, statistics on partitions are displayed by default, exclusive with -x
Output Example
# iostat -tkx 1
Linux 3.10.0-514.el7.x86_64 (rhel7-test.dev.fwmrm.net)  12/12/2019      _x86_64_        (8 CPU)

12/12/2019 06:06:58 AM
avg-cpu:  %user   %nice %system %iowait  %steal   %idle
           1.11    0.00    0.42    0.28    0.00   98.19

Device:         rrqm/s wrqm/s  r/s   w/s  rkB/s   wkB/s avgrq-sz avgqu-sz await r_await w_await  svctm  %util
vda               0.04  23.85 7.11 52.27 442.51 5702.99   206.97     0.84 14.22   0.47    16.09   0.28   1.64
Output Explanation
- Straight forward:
- Device: The device name as listed in /dev
- rrqm/s + wrqm/s: The number of requests merged per second were queued to the device io scheduler, Measured at the io scheduler
- r/s + w/s: The number of requests that were issued to the device completed by storage per second, Measured at io done
- rkB/s + wkB/s: The number of kilobytes read from/written to the device transferred between the host and storage per second, Measured at io done
- Special:
- avgrq-sz:
The average size (in 512b sectors) of the requests that were issued to the device completed by storage.
Combined average for both reads and writes:
(rkB/s + wkB/s)*2/(r/s + w/s)
Can derive average read/write io size:
(rkB/s*2)/(r/s) or (wkB/s*2)/(w/s) - avgqu-sz:
the average queue length of the requests that were issued to the device
The average number of requests within the io scheduler queue plus the average number of io outstanding to storage (driver queue)
/sys/block/sda/queue/nr_requests(io scheduler)
/sys/block/sda/device/queue_depth(driver)
It is measured between io scheduler and io done - await/r_await/w_await:
The average time (in milliseconds) for I/O requests
issued to the device to be servedcompleted by storage. This includes the time spent by the requests in the cheduler queue and the time storage spent servicing time
Measured at io done. - svctm:
The average effective storage service time (in milliseconds) for I/O requests that were
issued to the devicecompleted by storage
%util * 1000ms-per-second / #io-completed-per-second
await time doesn’t take into account parallelism within storage and includes queuing time within io scheduler
svctm in effect accounts for parallel io operations within storage and does not include queuing time within io scheduler - %util:
Percentage of sample interval during which I/O requests were issued to the device (bandwidth utilization for the device). Device saturation occurs when this value is close to 100%
Percentage of sample interval during there was at least 1 outstanding I/O request within the io scheduler/driver/storage
Device saturation for the current load point occurs when this value is close to 100% and the device is a single physical disk
It is often divorced from the maximum available device bandwidth with modern enterprise storage configurations.
- avgrq-sz:
The average size (in 512b sectors) of the requests that were issued to the device completed by storage.
iotop
Usage
# iotop –b –t –d 1 [-o]
-b non-interactive mode
-t add timestamp
-d interval(default 1 second)
-o only show process actually doing io
Output Sample
07:54:25 Total DISK READ :       0.00 B/s | Total DISK WRITE :       3.96 K/s
07:54:25 Actual DISK READ:       0.00 B/s | Actual DISK WRITE:      11.89 K/s
    TIME  TID PRIO USER     DISK READ  DISK WRITE  SWAPIN      IO    COMMAND
07:54:25  313 be/3 root      0.00 B/s    3.96 K/s  0.00 %  0.14 % [jbd2/vda2-8]
Output Explanation
Total DISK WRITE vs Actual DISK WRITE
Total is for read and write bandwidth from processes
Actual is for read and write bandwidth from processes and kernel
blktrace
Usage
# yum install blktrace
# mount –t debugfs debugfs /sys/kernel/debug
# mkdir /tmp/blktrace
# cd /tmp/blktrace
# date > date.txt; blktrace [dev list]
Ctrl + c to terminate blktrace
Note: /tmp/blktrace should be located anywhere other than devices monitored
Output Sample
  8,16   4     1870     0.292079290 16540  Q   R 2608235665 + 3 [act_storage]
  8,16   4     1871     0.292080710 16540  G   R 2608235665 + 3 [act_storage]
  8,16   4     1872     0.292081070 16540  P   N [act_storage]
  8,16   4     1873     0.292081958 16540  I   R 2608235665 + 3 [act_storage]
  8,16   4     1874     0.292082477 16540  U   N [act_storage] 1
  8,16   4     1875     0.292083026 16540  D   R 2608235665 + 3 [act_storage]
  8,16  17     1701     0.292155895 16543  Q   R 5762948120 + 3 [act_storage]
  8,16  17     1702     0.292156936 16543  G   R 5762948120 + 3 [act_storage]
  8,16  17     1703     0.292157313 16543  P   N [act_storage]
  8,16  17     1704     0.292157900 16543  I   R 5762948120 + 3 [act_storage]
  8,16  17     1705     0.292158471 16543  U   N [act_storage] 1
  8,16  17     1706     0.292158935 16543  D   R 5762948120 + 3 [act_storage]
  8,16  20     1744     0.292194512 16545  Q   R 3829073422 + 3 [act_storage]
  8,16  20     1745     0.292196855 16545  G   R 3829073422 + 3 [act_storage]
  8,16  20     1746     0.292197579 16545  P   N [act_storage]
  8,16  20     1747     0.292199215 16545  I   R 3829073422 + 3 [act_storage]
  8,16  20     1748     0.292200112 16545  U   N [act_storage] 1
  8,16  20     1749     0.292201140 16545  D   R 3829073422 + 3 [act_storage]
  8,16  12     1568     0.292209182     0  C   R 4785100612 + 3 [0]
  8,16  15     1260     0.292213294     0  C   R 4283170218 + 3 [0]
……
  8,16   4     1876     0.292535466     0  C   R 2608235665 + 3 [0]
Output Explanation
The standard header (or initial fields displayed) include:
%D %2c %8s %5T.%9t %5p %2a %3d Start block + number of blocks Process
- %D Display the event’s device major/minor as: %3d,%-3d
- %2c CPU ID (2-character field)
- %8s Sequence number
- %5T.%9t 5-character field for the seconds portion of the time stamp and a 9-character field for the nanoseconds in the time stamp
- %5p 5-character field for the process ID
- %2a 2-character field for one of the actions. Trace actions:
- Q–queued
This notes intent to queue i/o at the given location. No real requests exists yet. - G–get request
To send any type of request to a block device, a struct request container must be allocated first. - I–inserted
A request is being sent to the i/o scheduler for addition to the internal queue and later service by the driver. The request is fully formed at this time. - P–plug When i/o is queued to a previously empty block device queue, Linux will plug the queue in anticipation of future ios being added before this data is needed.
- M–back merge A previously inserted request exists that ends on the boundary of where this i/o begins, so the i/o scheduler can merge them together.
- F–front merge Same as the back merge, except this i/o ends where a previously inserted requests starts.
- U–unplug Some request data already queued in the device, start sending requests to the driver. This may happen automatically if a timeout period has passed (see next entry) or if a number of requests have been added to the queue.
- T–unplug Due to timer If nobody requests the i/o that was queued after plugging the queue, Linux will automatically unplug it after a defined period has passed.
- D–issued A request that previously resided on the block layer queue or in the i/o scheduler has been sent to the driver.
- C–complete A previously issued request has been completed. The output will detail the sector and size of that request, as well as the success or failure of it.
- X–split On raid or device mapper setups, an incoming i/o may straddle a device or internal zone and needs to be chopped up into smaller pieces for service. This may indicate a performance problem due to a bad setup of that raid/dm device, but may also just be part of normal boundary conditions. dm is notably bad at this and will clone lots of i/o.
- A–remap For stacked devices, incoming i/o is remapped to device below it in the i/o stack. The remap action details what exactly is being remapped to what.
- Q–queued
- %3d 3-character field for RWBS data
- R Read
- W Write
- B Barrier (deprecated)
- S Sync
btt
$ blkparse -i sdb.blktrace.* -d sdb.bin
$ btt -i sdb.bin
==================== All Devices ====================

   ALL             MIN             AVG            MAX           N
--------------- ------------- ------------- ------------- -----------

Q2Q               0.000000001   0.000048850   0.000387336      145458
Q2G               0.000000294   0.000001526   0.000249102     6982032
G2I               0.000000349   0.000001419   0.000256775     6982032
I2D               0.000000353   0.000001167   0.000044031     6982032
D2C               0.000031565   0.000262783   0.006139602      145453
Q2C               0.000034323   0.000266895   0.006142108      145453

==================== Device Overhead ====================

       DEV |       Q2G       G2I       Q2M       I2D       D2C
---------- | --------- --------- --------- --------- ---------
 (  8, 16) |  27.4427%  25.5142%   0.0000%  20.9913%  98.4595%
---------- | --------- --------- --------- --------- ---------
   Overall |  27.4427%  25.5142%   0.0000%  20.9913%  98.4595%
.......
Q------->G------------>I--------->M------------------->D----------------------------->C
|-Q time-|-Insert time-|
|--------- merge time ------------|-merge with other IO|
|------------------scheduler time ---------------------|--driver,adapter,storage time--|
|----------------------- await time in iostat output ----------------------------------|
- Q2Q time between requests sent to the block layer
- Q2G time from a block I/O is queued to the time it gets a request allocated for it
- G2I time from a request is allocated to the time it is Inserted into the device’s queue
- Q2M time from a block I/O is queued to the time it gets merged with an existing request
- I2D time from a request is inserted into the device’s queue to the time it is actually issued to the device
- M2D time from a block I/O is merged with an existing request until the request is issued to the device
- D2C service time of the request by the device
- Q2C total time spent in the block layer for a request
A Real Case
Data Collected
iostat from Intel 3710
04/17/2019 09:56:49 AM
avg-cpu:  %user   %nice %system %iowait  %steal   %idle
           0.13    0.00    0.97    9.82    0.00   89.08

Device:         rrqm/s   wrqm/s     r/s    w/s   rkB/s        wkB/s    avgrq-sz avgqu-sz   await r_await w_await  svctm  %util
sdb               0.00     0.00  20229.00 235.00 60071.00 30080.00    8.81     5.21         0.25       0.24      1.46    0.05 100.10
iostat from Intel 4600
04/17/2019 09:50:44 AM
avg-cpu:  %user   %nice %system %iowait  %steal   %idle
           0.15    0.00    0.72   15.05    0.00   84.08

Device:         rrqm/s   wrqm/s     r/s    w/s   rkB/s        wkB/s    avgrq-sz avgqu-sz   await r_await w_await  svctm  %util
sdb               0.00     0.00 20234.00  235.00 60205.00 30080.00   8.82      8.79         0.43      0.40    2.82      0.05 100.30
btt from Intel 3710
$ btt -i sdb.bin
==================== All Devices ====================

            ALL           MIN           AVG           MAX           N
--------------- ------------- ------------- ------------- -----------

Q2Q               0.000000001   0.000048850   0.000387336      145458
Q2G               0.000000294   0.000001526   0.000249102     6982032
G2I               0.000000349   0.000001419   0.000256775     6982032
I2D               0.000000353   0.000001167   0.000044031     6982032
D2C               0.000031565   0.000262783   0.006139602      145453
Q2C               0.000034323   0.000266895   0.006142108      145453

==================== Device Overhead ====================

       DEV |       Q2G       G2I       Q2M       I2D       D2C
---------- | --------- --------- --------- --------- ---------
 (  8, 16) |  27.4427%  25.5142%   0.0000%  20.9913%  98.4595%
---------- | --------- --------- --------- --------- ---------
   Overall |  27.4427%  25.5142%   0.0000%  20.9913%  98.4595%
btt from Intel 4600
$ btt -i sdb.bin
==================== All Devices ====================

            ALL           MIN           AVG           MAX           N
--------------- ------------- ------------- ------------- -----------

Q2Q               0.000000001   0.000048850   0.000455220      134261
Q2G               0.000000296   0.000001499   0.000056508     6444576
G2I               0.000000375   0.000001338   0.000051724     6444576
I2D               0.000000359   0.000001100   0.000307657     6444576
D2C               0.000075813   0.000420482   0.006191458      134249
Q2C               0.000079661   0.000424418   0.006201090      134249

==================== Device Overhead ====================

       DEV |       Q2G       G2I       Q2M       I2D       D2C
---------- | --------- --------- --------- --------- ---------
 (  8, 16) |  16.9548%  15.1363%   0.0000%  12.4385%  99.0724%
---------- | --------- --------- --------- --------- ---------
   Overall |  16.9548%  15.1363%   0.0000%  12.4385%  99.0724%
Analysis for Read Requests
read request D2C time analysis for Intel 3710
          x < .000026           0
.000026 < x < .000052           54
.000052 < x < .000078           66
.000078 < x < .000104           500
.000104 < x < .000130           2660
.000130 < x < .000156           2700
.000156 < x < .000182           2055
.000182 < x < .000208           3458
.000208 < x < .000234           4945
.000234 < x < .000260           1022
.000260 < x < .000520           1773
.000520 < x < .000780           471
.000780 < x < .001040           139
.001040 < x < .001300           77
.001300 < x < .001560           41
.001560 < x < .001820           44
.001820 < x < .002080           43
.002080 < x < .002340           38
.002340 < x < .002600           34
.002600 < x < .002860           48
read request D2C time analysis for Intel 4600
         x < .00008             0
.00008 < x < .00012             1156
.00012 < x < .00016             2522
.00016 < x < .00020             3679
.00020 < x < .00024             3984
.00024 < x < .00028             2733
.00028 < x < .00032             698
.00032 < x < .00036             592
.00036 < x < .00040             345
.00040 < x < .00080             2118
.00080 < x < .00120             820
.00120 < x < .00160             638
.00160 < x < .00200             492
.00200 < x < .00240             290
.00240 < x < .00280             83
.00280 < x < .00320             32
.00320 < x < .00360             24
.00360 < x < .00400             9
.00400 < x                      13
Conclusion
As a big difference was shown between svctm and await in iostat, we suspect there should be some pending was happened in io scheuduler or somewhere else in OS. Finally, we confirmed it is hardware performance issue from btt.